


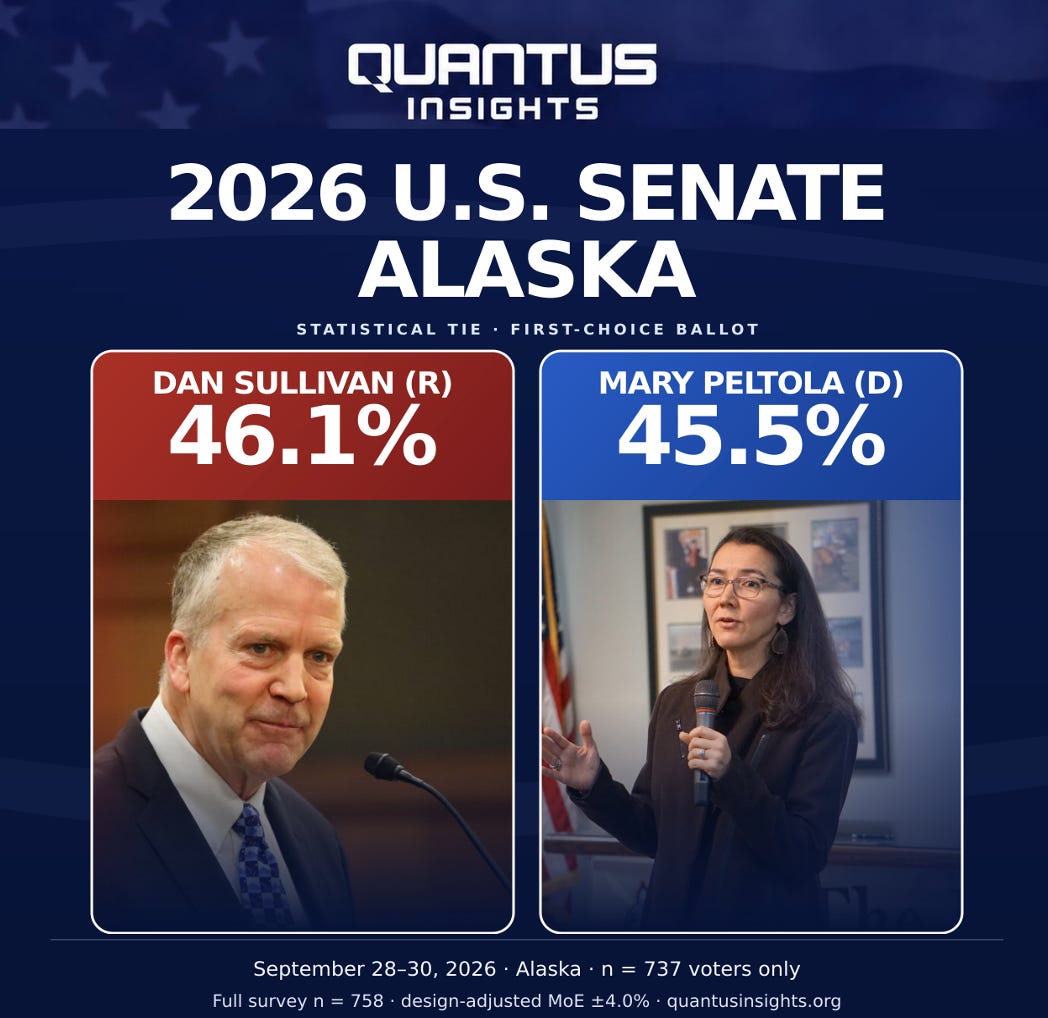
I spent the last few days of September in Alaska, at least in the way a pollster visits a state: through 758 text-message interviews with likely voters, weighted, raked, bootstrapped, and argued over. We released the full survey through Quantus Insights this morning. This is my own read on what it says, and what I think it leaves open.
The topline is about as close as a poll can get. Dan Sullivan, the Republican incumbent, takes 46.1 percent of the first-choice vote. Mary Peltola, the former congresswoman, takes 45.5. That is a 0.6-point gap in a survey where the margin on a difference between two candidates runs to about eight points. I’m not going to dress it up: it’s a tie. When we asked the question four different ways, as the full ballot, as a head-to-head, and with undecideds pushed to a lean in both versions, Sullivan came out ahead every time, by between 0.3 and 0.6 points. Four tries, four ties, all leaning the same direction. That consistency tells me the sample is stable. It does not tell me who wins.
Two Alaskas, roughly equal in size
What makes this race interesting isn’t the margin. It’s that the margin is produced by two coalitions that barely overlap and happen to be the same size.
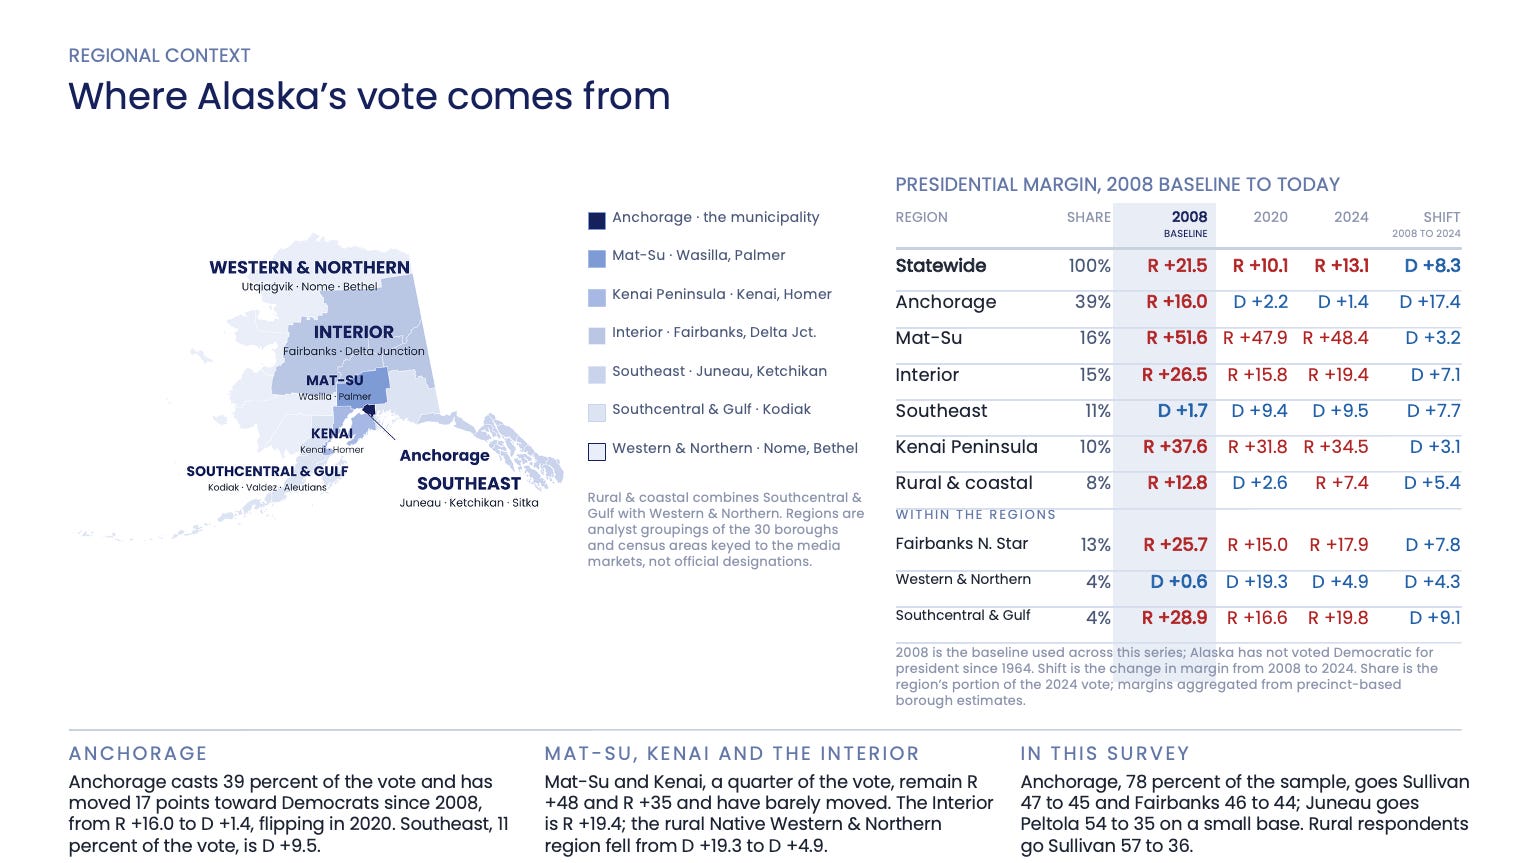
Sullivan’s Alaska is rural, male, and older. Rural voters, nearly half the electorate, back him 57 to 36. Men go 52 to 41 his way. Voters 65 and up give him a six-point edge. This is the Alaska of Mat-Su and the Kenai Peninsula, where Donald Trump won by 48 and 35 points in 2024 and where the ground has hardly moved since 2008.
Peltola’s Alaska is urban, suburban, female, and educated. Urban voters go 58 to 30 for her, suburbs 56 to 39, women 52 to 40, graduate-degree holders 59 to 31. This is Anchorage, which casts 39 percent of the statewide vote and has drifted 17 points toward Democrats since 2008, flipping in 2020 and staying flipped.
Each side’s partisans are locked in: Republicans at 87 percent for Sullivan, Democrats at 94 for Peltola. The whole contest is sitting in the lap of unaffiliated voters, who make up 47 percent of our sample and favor Peltola 56 to 34. A 22-point edge among independents is what lets a Democrat tie a Republican incumbent in a state Trump carried by 13.
The likability gap
If there is an asymmetry in this race, it’s here. Both candidates are completely defined; about one voter in ten lacks an opinion of either, and two-thirds hold a strong view of each. Within that fully formed opinion, Peltola is above water and Sullivan is not. She sits at 47.9 favorable to 43.3 unfavorable, net +4.6. He is at 43.4 to 46.6, net −3.2, with more than a third of the electorate very unfavorable toward him.
Among the unaffiliated voters who decide this, the spread is stark: Peltola is net +24, Sullivan net −27. Among suburban voters, +13 against −17. Sullivan’s one clear reservoir of goodwill is rural Alaska, where he is net +15 and Peltola is roughly even.
A candidate can win while underwater. Incumbents do it regularly. But it means Sullivan’s path runs through turnout rather than persuasion, and Peltola’s runs through a bloc of independents who already like her and have not quite finished deciding.
Why I trust the sample
One check we used to calibrate the sample run was to ask people how they voted last time. Our respondents recall choosing Trump over Kamala Harris 50.3 to 39.4, a 10.9-point margin. The certified result was 13.1. Recall sometimes understate or even overstate the winner, so a sample that remembers a slightly narrower Trump win is behaving the way a good sample should. Sullivan’s edge isn’t an artifact of too many Republicans on the phone.
Where we differ from the field
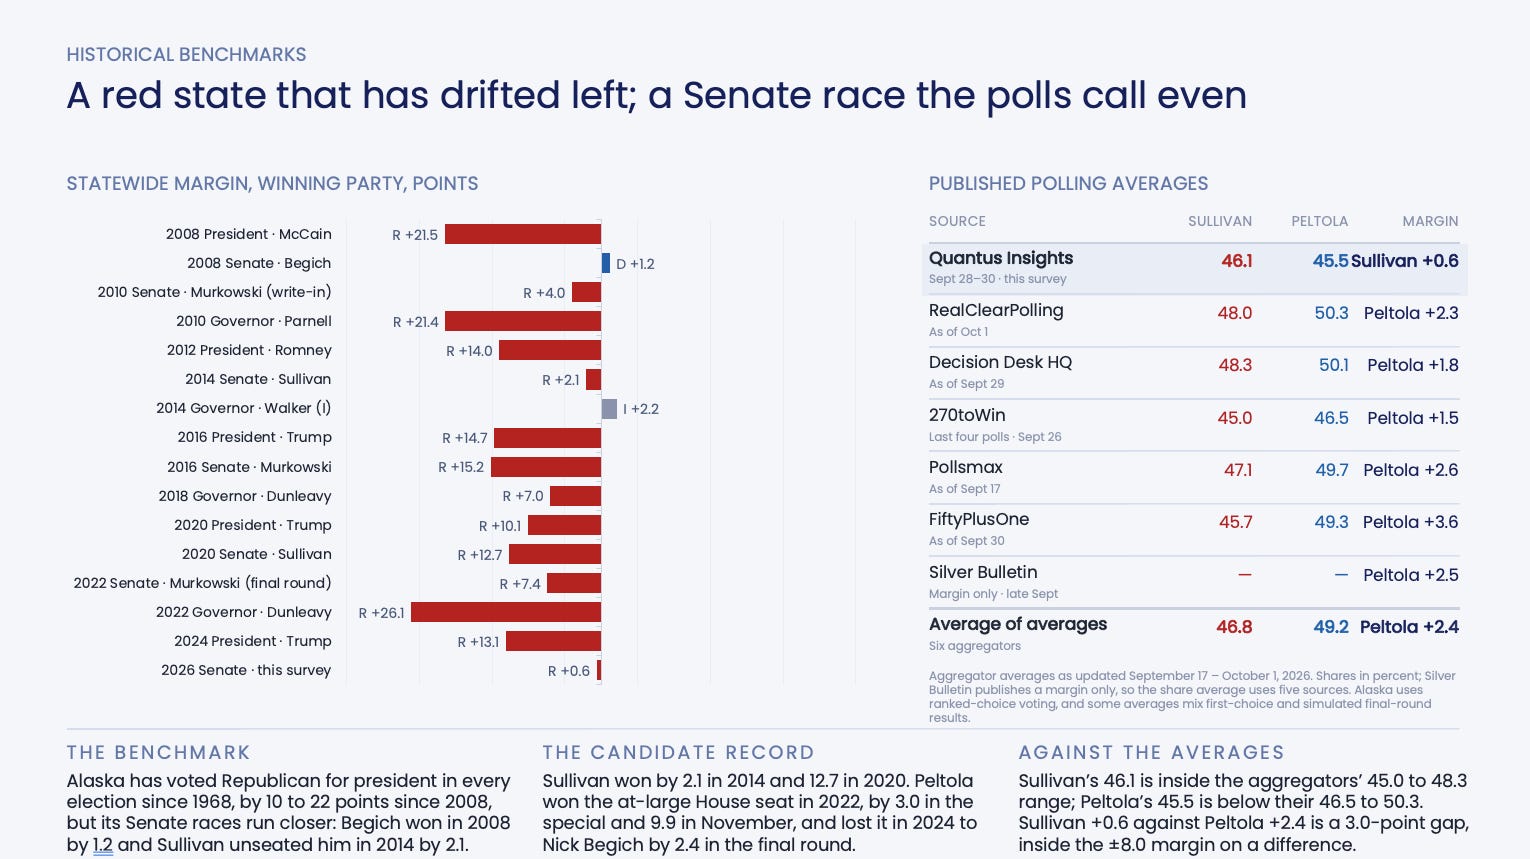
Six public aggregators have Peltola ahead, by 1.5 to 3.6 points, averaging about +2.4. We’re three points to the right of that. It’s inside the noise, but it’s worth being transparent about where the gap sits. Our number for Sullivan, 46.1, is within the aggregators’ range for him. Our number for Peltola, 45.5, is a point or more below theirs. The difference lives in our undecided and minor-candidate columns, not in Sullivan’s share. Either we’re picking up softness in her support that others aren’t, or we’re seeing noise. I don’t know yet which, and a second wave would tell.
What I’ll be watching
Alaska votes Republican for president by double digits and then turns around and makes its Senate races close. Mark Begich won by 1.2 in 2008; Sullivan beat him by 2.1 in 2014. This race looks like it belongs to that lineage.
Eight percent of likely voters are not yet with either nominee, which is more than ten times the gap between them. Alaska’s ranked-choice final round will redistribute most of that. When we pushed the undecideds, they split almost evenly, which is the least helpful thing an undecided voter can do for a forecaster.
So I’ll say what the data lets me say: this is a dead heat, with a slight and persistent Sullivan lean on the first-choice ballot, a likability advantage for Peltola, and an outcome that depends on whether rural Alaska turns out at 2024 levels or Anchorage’s independents finish the sentence they’ve started. Thirty-four days to find out.
Full crosstabs and methodology are at quantusinsights.org/polling